Examples of quality of service presentation by regulators
25.08.2020Uganda
Two parameters (both for voice) were measured for four operators in eleven cities (UCC 2019). The numbers of measurements (and the confidence intervals) were not stated.
The measurement results are shown below for the voice parameters in the three cities in one region, East.
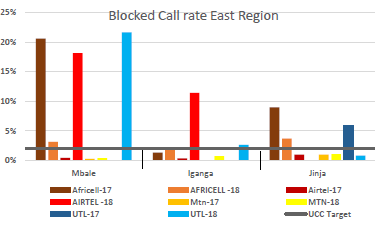
Source: UCC 2019.
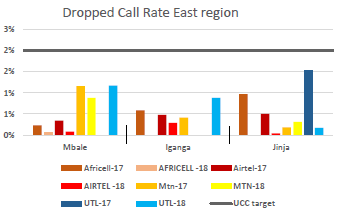
Source: UCC 2019.
Ghana
Eight parameters (five for voice and three for data) were measured for four operators in 119 districts of five regions (NCA 2018). The numbers of measurements (and the confidence intervals) were not stated.
The measurement results were tabulated separately for each operator. They are shown here for the voice parameters and data parameters in one region, Ashanti, for one operator, Glo.
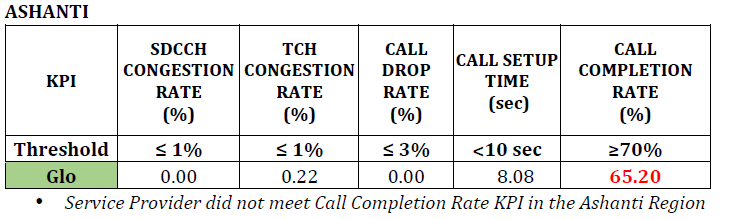
Source: NCA 2018
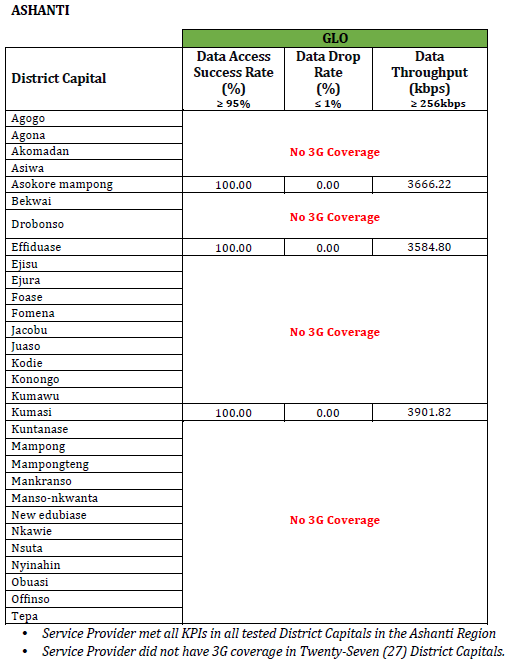
Source: NCA 2018
South Africa
Twenty-seven parameters (four for voice, six for file transfer, nine for web browsing, five for streaming, and three for latency) were measured for four operators in five provinces (ICASA 2019a; ICASA 2019b). Measurements were made in drive tests and by unattended probes. At least 120 measurements were made for every parameter in each locality.
The data parameters provided four sets of measurement results, distinguishing between 3G and 4G and between drive testing and unattended probes.
The tables shown below are the summaries of many of the results for all of the voice parameters and all of the data parameters for one set of results, for drive testing of 3G in one province, Eastern Cape, where 3 121 kilometres of roads with five unattended probes were monitored. There are also bar charts (for voice) and tables (for data) for individual parameters in separate localities, which are displayed here for voice MOS and streaming MOS.
Only the voice parameters have targets; measurement results that fail to reach targets are marked in red. The data parameters have cells highlighted in green to indicate the best performing operator. Good quality is indicated by high values in some cases and by low values in others.
Measurements like these have been made each year for some years. Following them, the operators describe their plans for improving services in the localities where quality is not good enough. These plans often involve the introduction of extra base stations or the addition of capacity to existing base stations.
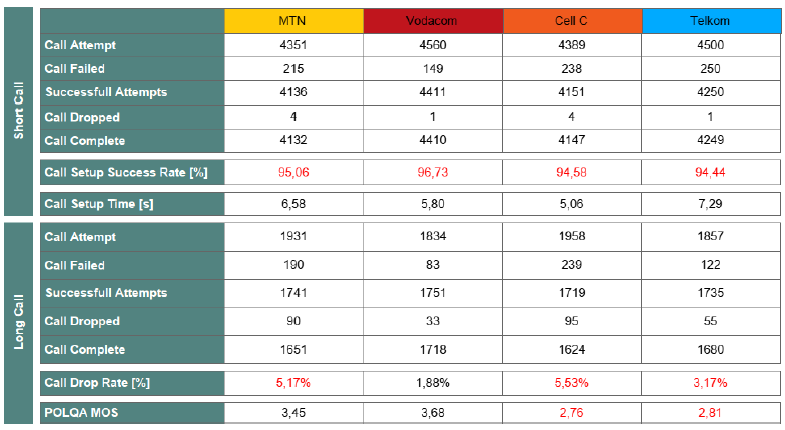
Source: ICASA 2019a.
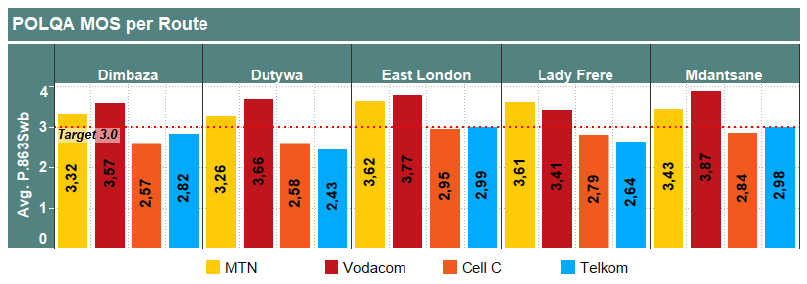
Source: ICASA 2019a.
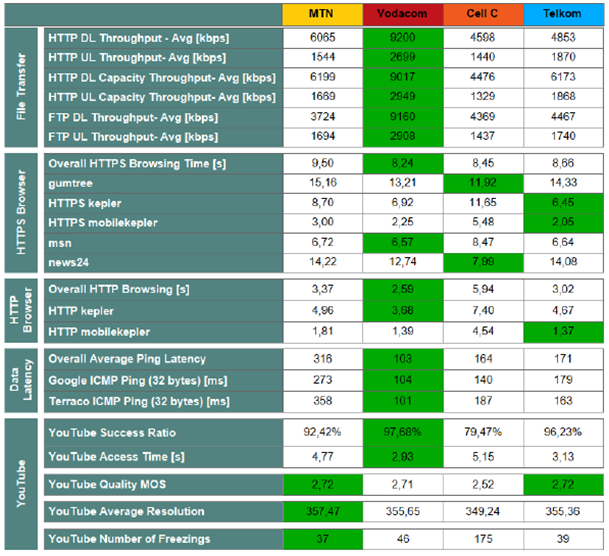
Source: ICASA 2019b.
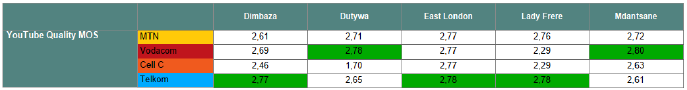
Source: ICASA 2019b.
Mauritania
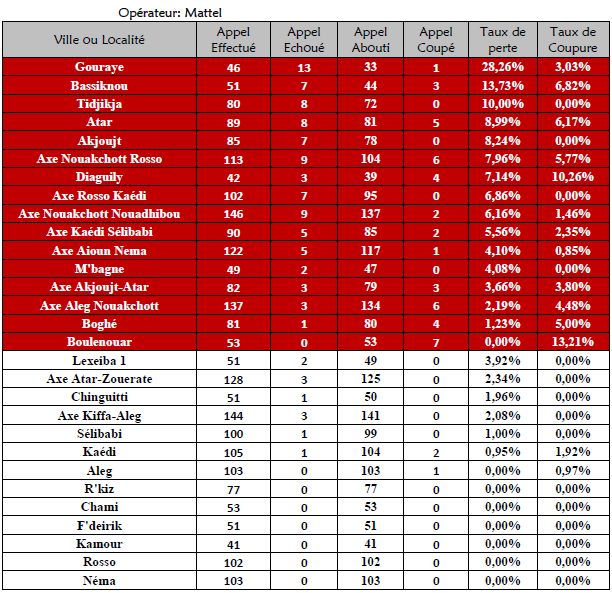
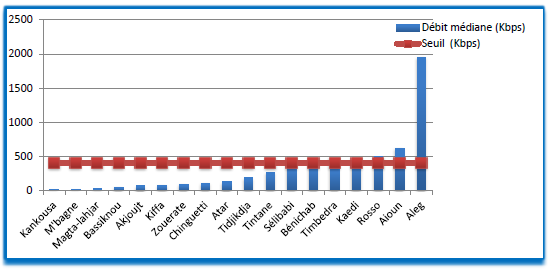
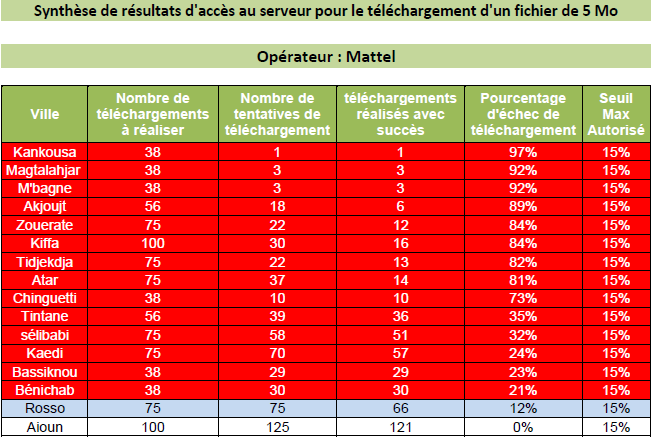
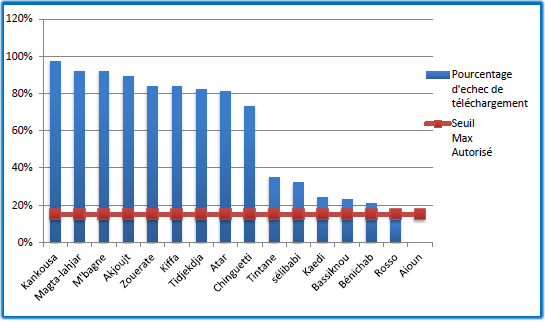
Four parameters (three for voice and one for file transfer) were measured for three operators in 29 localities (ARE 2020). About 3 535 measurements were made for each voice parameter and about 2 455 measurements were made for each data parameter in drive tests and by unattended probes.
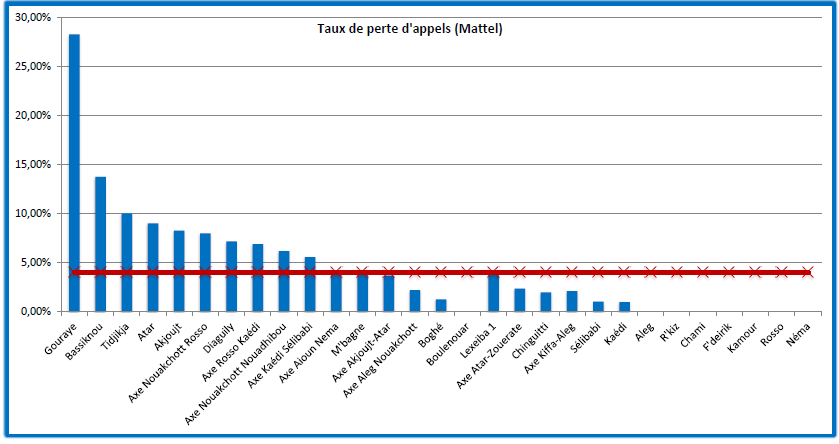
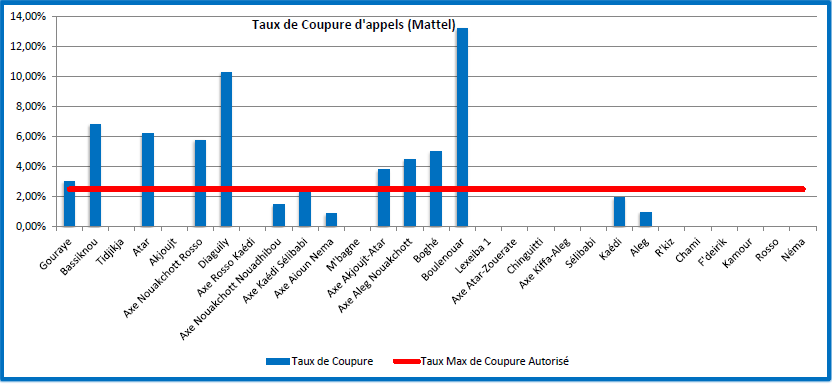
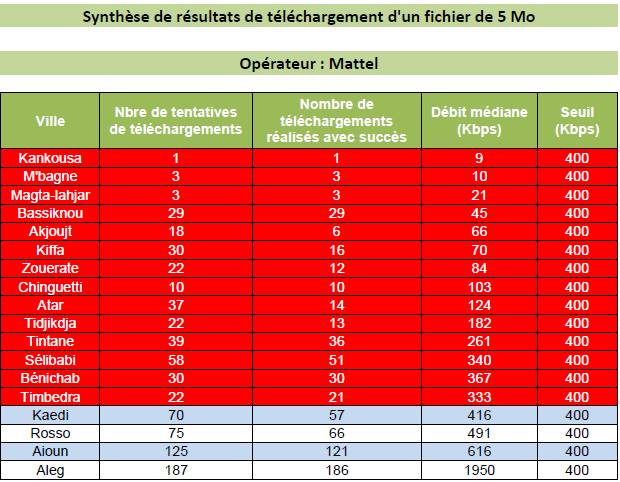
The measurement results were tabulated separately for each operator. They are shown below for one operator, Mattel. There are also bar charts for individual parameters in separate localities, which are displayed here for proportions of failed calls, proportions of dropped calls, speeds of downloads, and proportions of failed downloads.
Measurements like these have been made about twice each year for some years. Following them, fines of USD 3.6 million (2020), USD 1.6 million (2019), USD 1.2 million (2017), and USD 1.2 million (2016) have been announced.
Source: ARE 2020.
Source: ARE 2020.
Source: ARE 2020.
Source: ARE 2020.
Source: ARE 2020.
Source: ARE 2020.
Source: ARE 2020.
Côte d’Ivoire
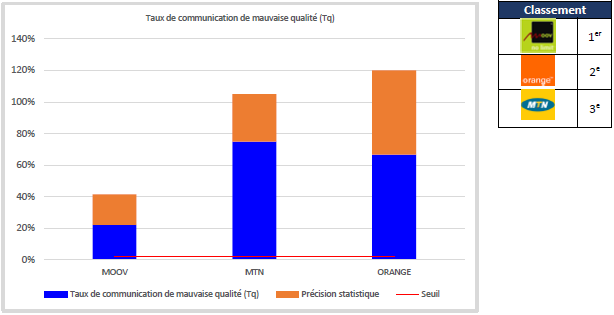
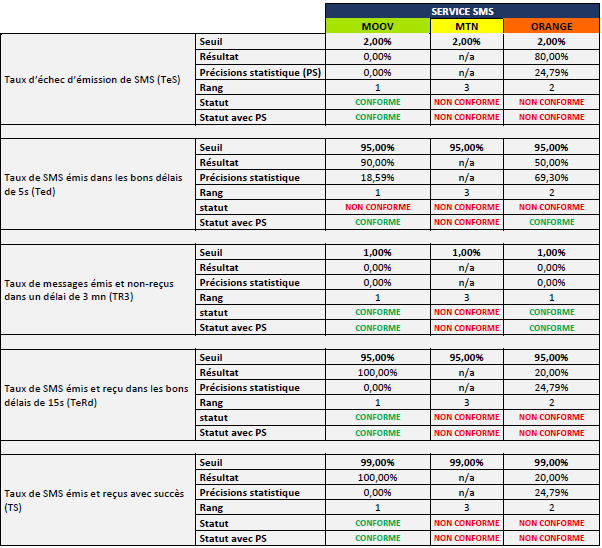
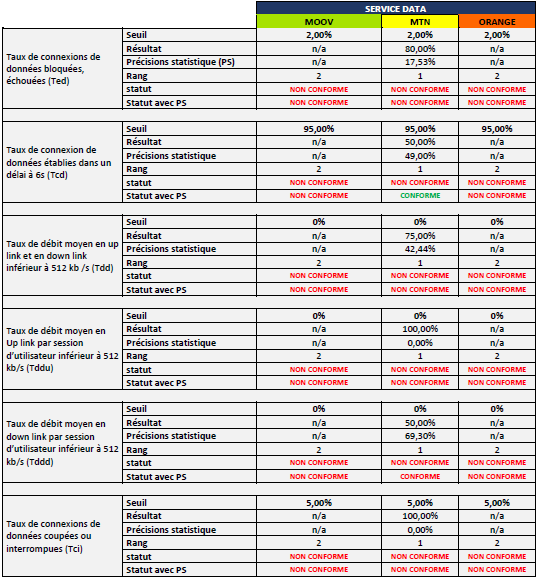
Thirty-three parameters (six for voice, six for SMS, ten for file transfer, four for web browsing, four for streaming and three for signal strength) were measured for three operators in 89 districts of four regions (ARTCI, 2019). Measurements were made in drive tests and by unattended probes.
The tables shown here are the summaries of most of the results for one district, Missouhmian, where 16 kilometres of roads with two unattended probes were monitored. There are also bar charts with confidence intervals and pictorial rankings of operators for individual parameters, which are displayed here for the proportions of calls having MOS higher than the target, 3.1.
To judge from the confidence intervals, about 48 measurements were made for each voice parameter, about 10 measurements were made for each SMS parameter and about 16 measurements were made for each data parameter. Except in the case of voice, the results have little statistical significance unless aggregated with the results for other districts.
Reports are available also for the other districts and, with aggregated results, for each region.
Good quality is indicated by high values in some cases and by low values in others.
Source: ARTCI 2019.
Source: ARTCI 2019.
Source: ARTCI 2019.
Source: ARTCI 2019.
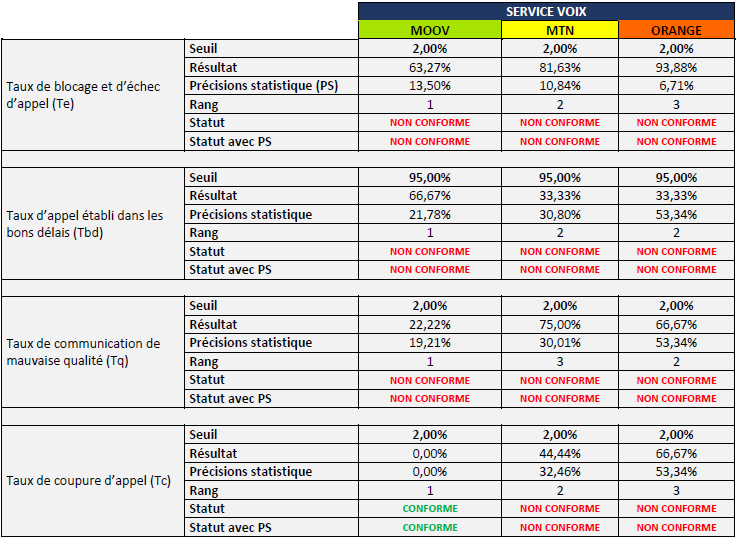
Congo
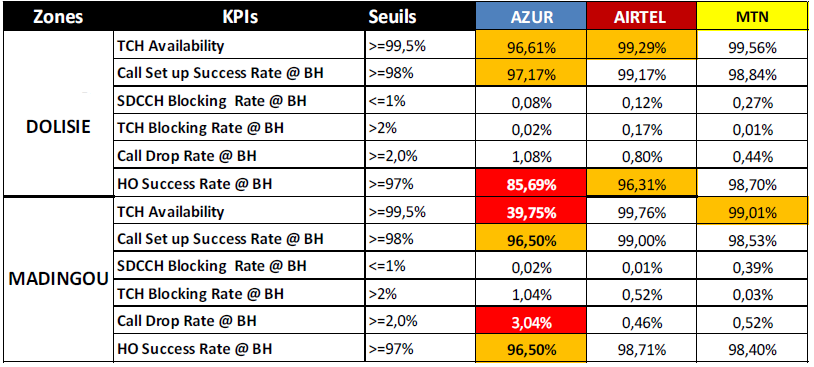
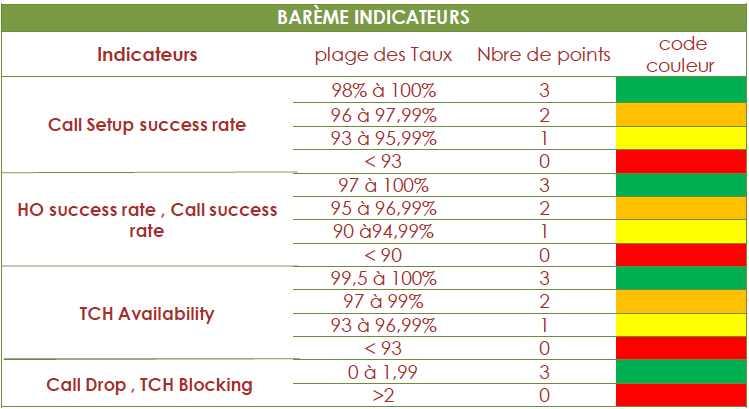
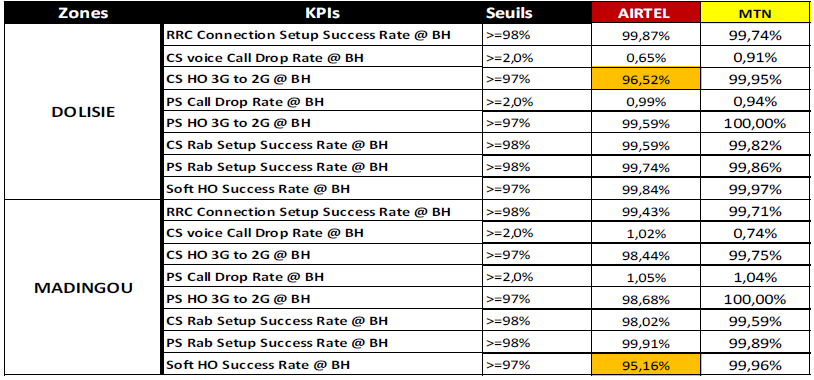
Thirteen parameters (all for voice, splitting 2G from 3G to distinguish circuit switching from packet switching) were measured for three operators in eight urban localities and ten “interior” localities (ARPCE 2018). Measurements were made in system readings, which, if they reported on all calls, not just on a sample of calls, would eliminate the need for calculating confidence intervals.
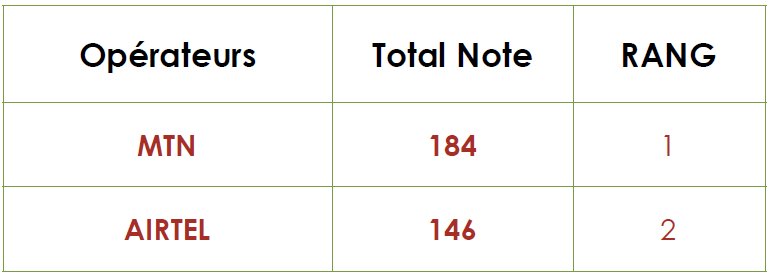
The measurement results are shown below for two of the “interior” localities for 2G and 3G.
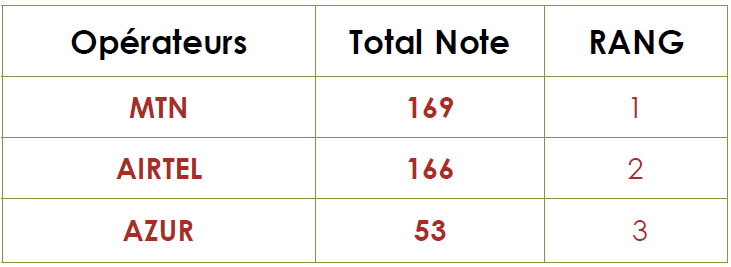
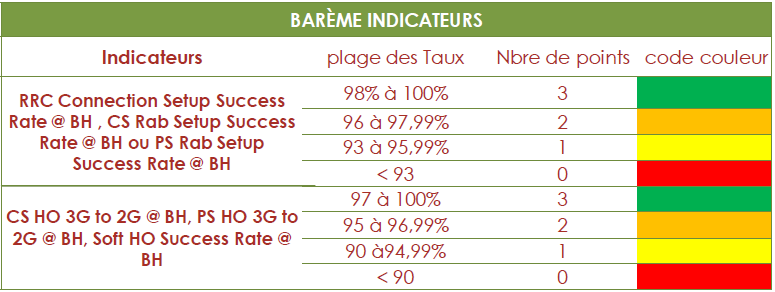
Points were assigned to each operator according to their measurement. The points were then summed to obtain overall scores and ranks. Good quality is indicated by high values in some cases and by low values in others.
One operator performed better than the others in all categories and was declared by the regulator to have the best 2G and 3G network over the whole extent of the territory, for the fourth quarter of 2017. Though the measurements are said to be made twice in each year, only once have they been published.
Source: ARPCE 2018.
Source: ARPCE 2018.
Source: ARPCE 2018.
Source: ARPCE 2018.
Source: ARPCE 2018.
Source: ARPCE 2018.
References
ARE. 2020. Contrôle de la qualité de service des opérateurs des télécommunications: Mattel sa, Mauritel sa et Chinguital sa Période 17 avril à 22 mai 2020. http://www.are.mr/pdfs/Rapport_QoS_Mai_final_2020.pdf.
ARPCE. 2018. Rapport d’évaluation de la QoS offerte par les opérateurs de téléphonie mobile (4eme trimestre 2017), https://www.arpce.cg/upload/publications/Observatoire-07-02-18-Final.pdf.
ARTCI. 2019. Rapport du contrôle inopiné de la qualité de service (QoS) des réseaux de téléphonie mobile 2019. https://www.artci.ci/index.php/controles/qualite-de-services/16-qos-telephonie-mobile/416-rapport-du-controle-inopine-de-la-qualite-de-service-qos-des-reseaux-de-telephonie-mobile-2019.html.
ICASA. 2019a. Voice QoS Report for Eastern Cape Province 2018 19 Q4. https://www.icasa.org.za/uploads/files/voice-qos-report-for-eastern-cape-province-2018-19-q3.pdf.
ICASA. 2019b. Mobile Data QoS Report for Eastern Cape Province 2018 19 Q4. https://www.icasa.org.za/uploads/files/mobile-data-qos-report-for-eastern-cape-province-2018-19-q3.pdf.
NCA. 2018. Quality of Service Test Results for March 2018. https://nca.org.gh/assets/Uploads/QoS_Test_Results_for_MNOs_v2.pdf.
UCC. 2019. Results of Quality of Service Measurements for Mobile Voice Telephony Services in Uganda. https://www.ucc.co.ug/wp-content/uploads/2017/09/QoS-PERFORMANCE-REPORT-FOR-MOBILE-VOICE-TELEPHONY-SERVICES-2017-2018.pdf.
Last updated on: 19.01.2022