How the growth of data traffic affects interconnection charges
26.08.2020The growth of data
Source: Incyte Consulting Ltd.
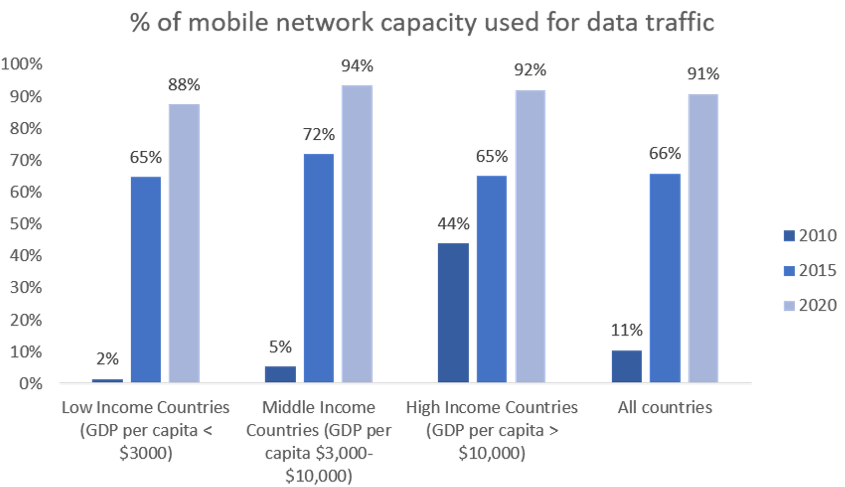
It is well known that data traffic has exploded in recent years while voice traffic has declined. This trend has been fuelled by over-the-top (OTT) applications taking traffic away from traditional voice services on fixed and mobile networks, by the increasing amount of Internet traffic and, most dramatically of all, by the explosion in video-based applications which now represents 73 per cent of all traffic (Cisco 2020). At the same time, the residual voice traffic has migrated from fixed to mobile networks. These trends have created a dramatic shift in traffic patterns, as shown in the diagram above, which is based on traffic data inputs to regulatory cost models constructed over the past 10 years in 13 different countries.
The impact on interconnection charges
The rapid growth of data traffic has affected interconnection charges. These charges are mostly set on the basis of cost models: the ITU tariff policies survey of 2019 revealed that 69 per cent of countries are using cost models to determine interconnection rates.[1] As traffic is the major cost driver within both fixed and mobile networks, the explosion in data traffic over recent years has led to a much greater proportion of shared network costs being allocated to data services. As the diagram above shows, in the latest mobile network cost models, typically 91 per cent of the shared traffic-related cost base is now allocated to data services. In fixed networks, the proportion of capacity used for data services is even higher, about 99 per cent.[2]
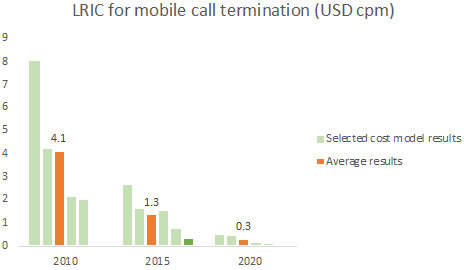
With virtually no traffic-related costs being allocated to them, the cost of voice services has been reduced to little more than the service-specific costs, mainly the switching centres and certain systems, such as the voicemail, that are used only for voice services. Furthermore, the predominant costing methodology used by regulators is bottom-up long-run incremental costs (BU-LRIC) which calculates costs based on the efficient deployment of modern assets.[3] This means that prices are set on the basis of a hypothetical network that is designed to meet the current (or forecast) level of demand in any individual year. As voice traffic volumes fall, so the scale of voice-specific network assets in the cost models is reduced, and there is little or no increase in the service-specific unit costs.
The results can be seen in the figure below which shows how typical BU-LRIC results for mobile call termination have fallen between 2010 and 2020. The same impact can be witnessed in the case study on mobile termination rates in the European Union.[4]
Source: Incyte Consulting Ltd.
Endnotes
- 122 countries are using cost models; 54 are not. ↑
- Based on the 91 per cent figure for mobile networks and assuming that about 20 per cent of data (Cisco 2020) and 75 per cent of voice traffic (Statista 2019) is now on mobile networks. ↑
- According to the ITU World Tariff Policies Database (2019), 92 countries are using versions of LRIC, while 28 are using versions of fully distributed cost (FDC) models and 40 are using benchmarking. See ↑
- See Digital Regulation Platform thematic section on “The decline and fall of mobile termination rates in Europe.” ↑
References
Cisco. 2020. Annual Internet Report, 2018-2023. https://www.cisco.com/c/en/us/solutions/collateral/executive-perspectives/annual-internet-report/white-paper-c11-741490.pdf.
Statista. 2019. “Distribution of Voice Traffic on Telecommunication Networks in the United Kingdom (UK) from 2009 to 2016, by Type.” Statista. https://www.statista.com/statistics/276598/voice-traffic-on-fixed-and-mobile-networks-in-the-united-kingdom-uk/.
Last updated on: 19.01.2022